
Q3 2020

Welcome back to our Transparency Report series. All our past Transparency Reports can be accessed here.
Before we dive in, I have to tell you something.
We have decided to turn our monthly report into a quarterly report. You might be wondering why. The truth is, producing such a report on a monthly basis takes a lot of time and energy which we simply don’t have at the moment.
It also makes more sense as we feel like we will have way more insights and progress to share with you on a quarterly basis.
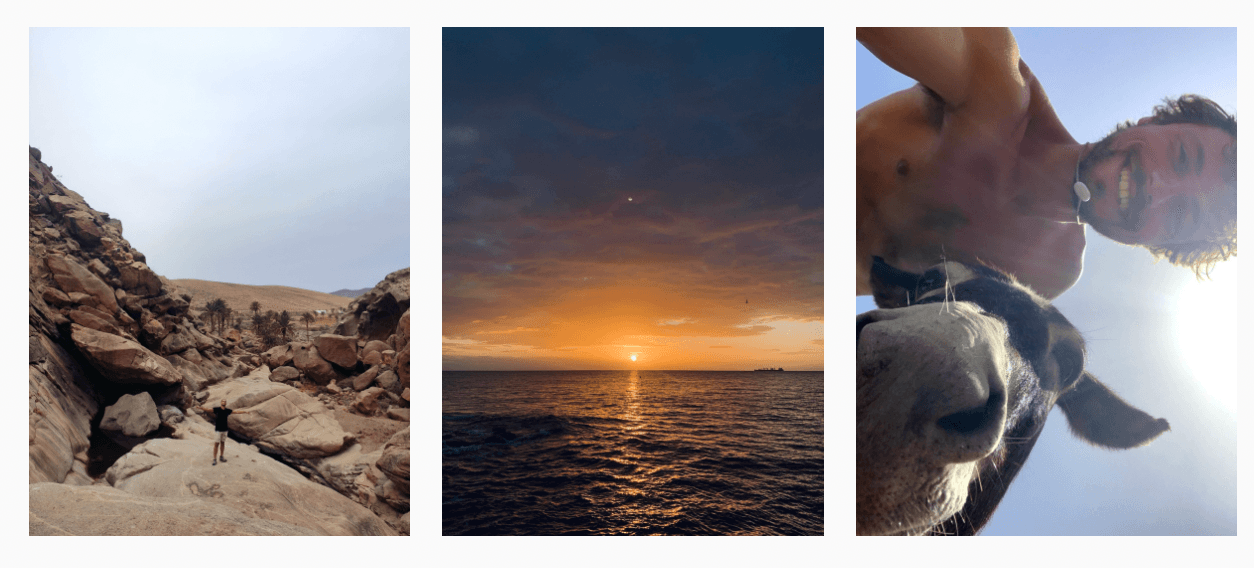
If you’ve read our last report you know that we have decided to slow down a bit during the summer and enjoy the little things. Here is a sneak peek of what we have been up to. More about this at the end of the report. 🙂
Ok, let’s kick this off because a lot has happened since the last time we spoke.
The last three months have been pretty good to us and we made a lot of progress. We are now at 20,423 MRR which is pretty good (more details to come).
We really enjoy taking you along the journey of growing our new software products (Wild Mail & Wildmetrics) from €10,000 MRR to €50,000 MRR via this transparency report and we hope you still love reading it.
By the way, if you’re new to Wild Audience, here’s what we do in one sentence: At Wild Audience we help companies build authentic relationships with marketing automation to grow their business.
We do that through our suite of products:
Wild Mail [marketing automation software]
Wildmetrics [ROI tracking for campaigns, funnels & acquisition channels]
Automation University [membership to learn about marketing automation]
Time to dive in now and see what happened in Q3 of 2020.
Transparency Report:
Revenue
Customer Success
Product
Marketing
HR
Founder Talk
Revenue
By the end of the third quarter of 2020, we managed to grow our MRR to 20,423€. Let’s do a breakdown and compare the numbers with the last quarter (Q2).
Quarterly Breakdown:
If you look at the image below you can see that our growth rate was 33% in Q3 against 37% in Q2 and which is fairly similar so we can say that our growth rate is stable.
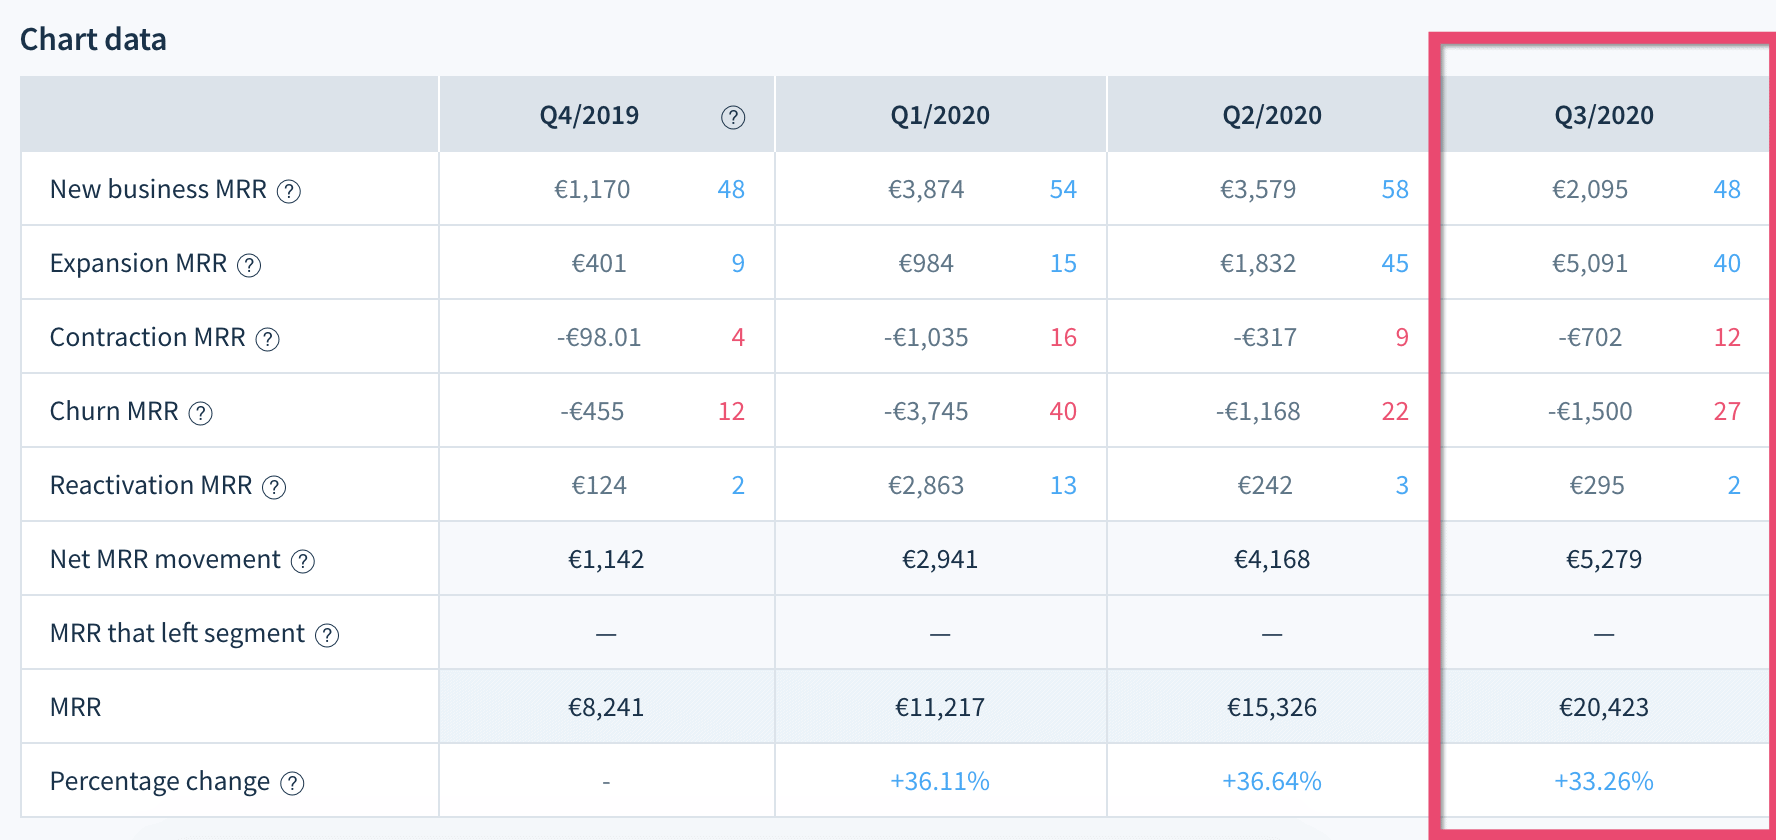
We can also see that the average growth per month was 10% for Q3 and 11% for Q2 so again it’s pretty much the same and above 10 is good for us.
In Q3, expansion MRR was always higher than new business MRR so the majority of our revenue came from expansions which was the opposite in Q2. That’s interesting as it means that for us that growth will mainly come from existing customers in the future. It also means that existing customers will be our new growth focus. We like that a lot.
In August, we also experienced what it means to acquire a really big customer (above 1k in MRR) and we learnt a few things from it. Revenue can grow very quickly with big accounts but it can also decrease very quickly if they decide to leave.
Losing a big account could mean losing a big part of your MRR if they leave so relying on really big accounts is too risky and that’s definitely not what we want. We would rather have a majority of small and medium accounts because when they go, it doesn’t impact our revenue that much. I guess it’s all about balance here.
Monthly Breakdown:
Let’s have a look at our monthly progression now:
July 14%
August 4%
September 13%
So our average growth rate this quarter was 10% because of August. This was to be expected as it is always a slow month with the summer holidays and it is not worrying us.
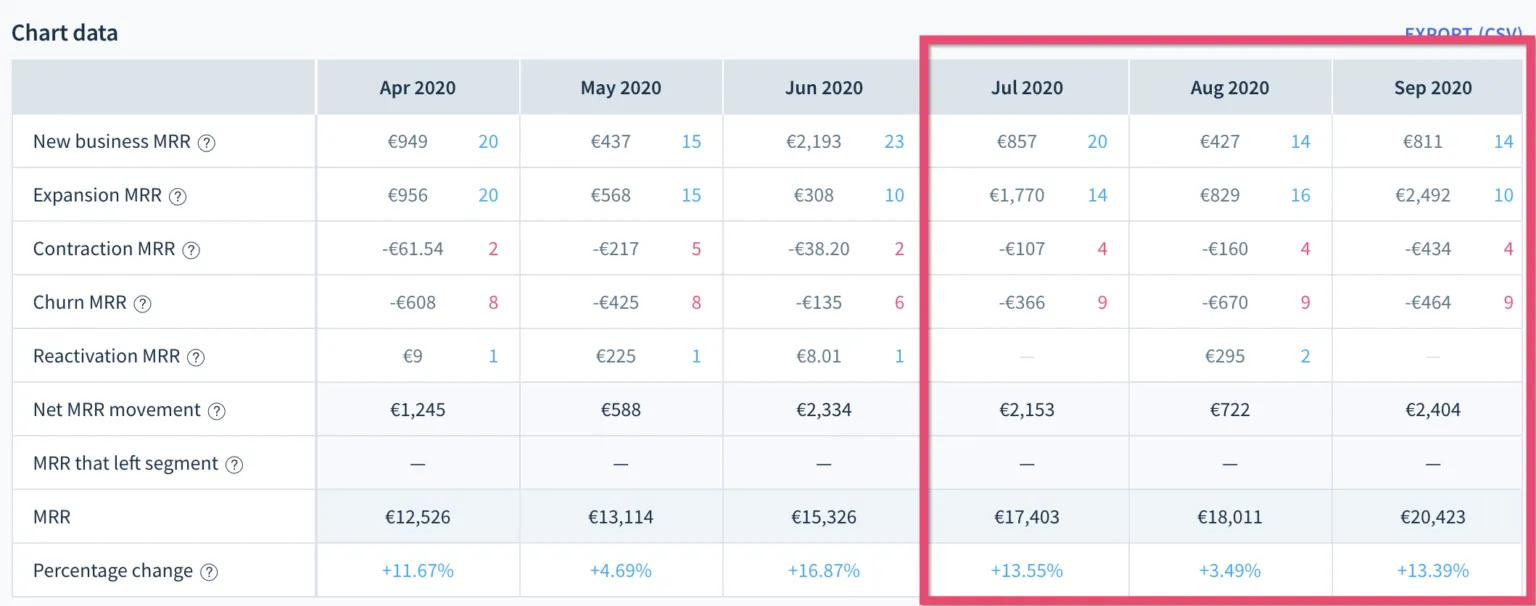
When it comes to new business, our monthly goal is 1k so we were close to reaching it in July and September. If we take a closer look at new business in September and do the maths we can see we have 21% of medium/big accounts (above €100) and 70% of small ones (between €0 and €46).
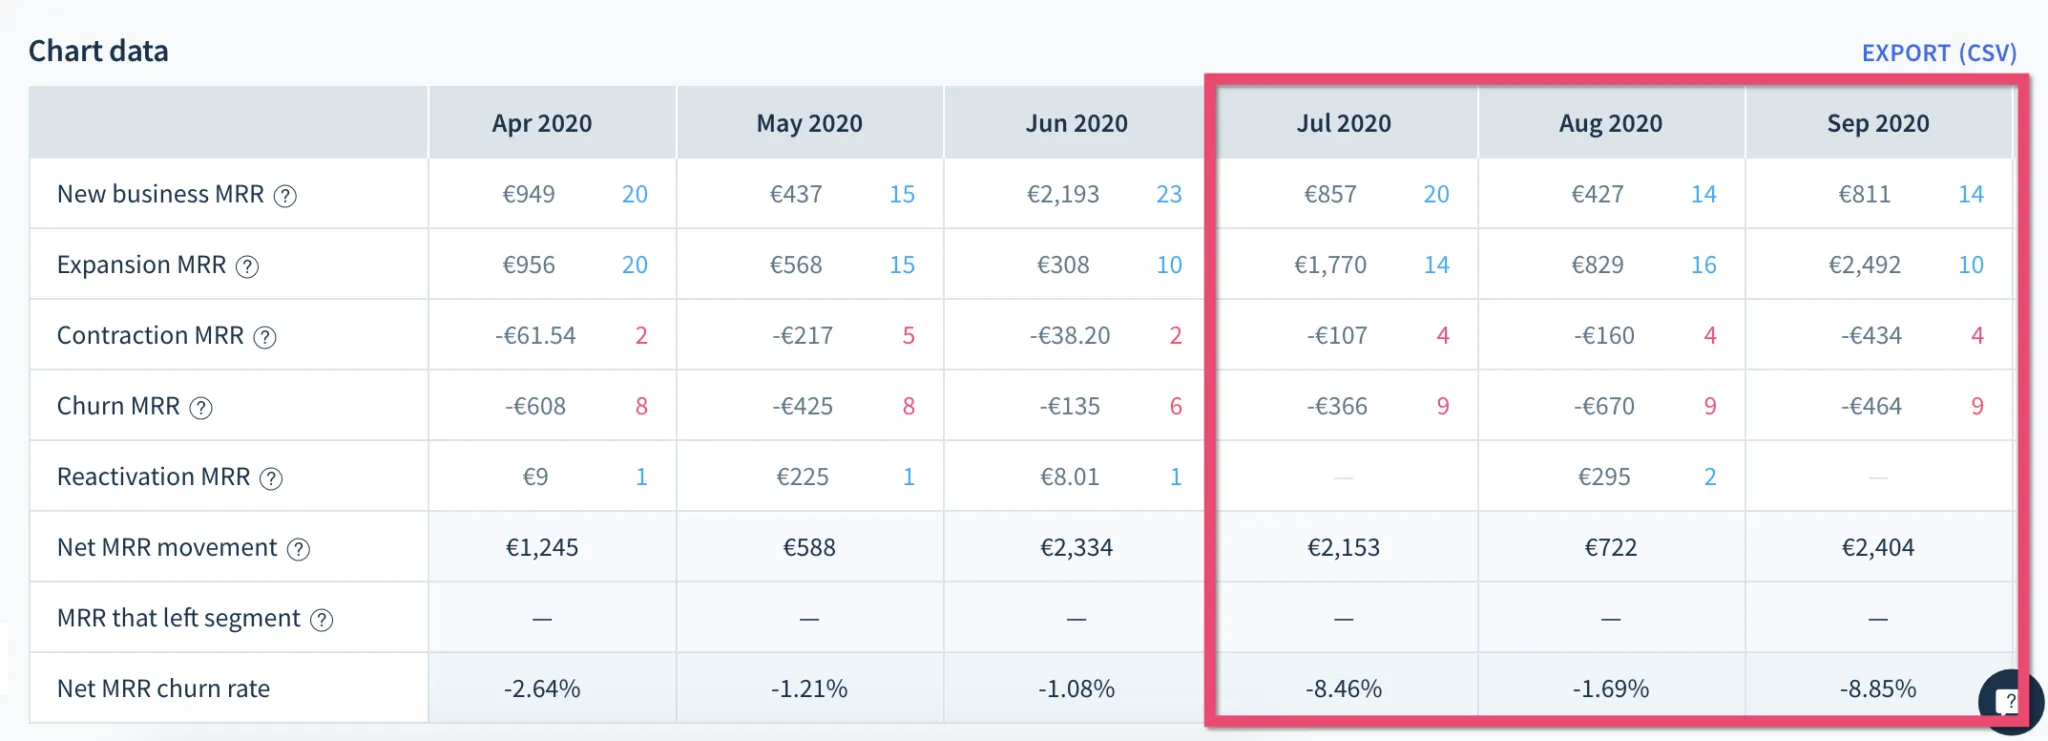
Churn:
Our churn rate is looking good and we are pretty happy about it. On average our churn rate was -6.3% in Q3 against -1.6% in Q2. That means that we would still grow without adding new business (thanks to expansions).
Remember, when it comes to your churn rate, the higher (negative) the better!
Customer Success
Back to you guys because you are the most important people in our business.
In Q3 of 2020, we had a total of 905 conversations with 456 customers which is lower than usual but totally normal during summertime.
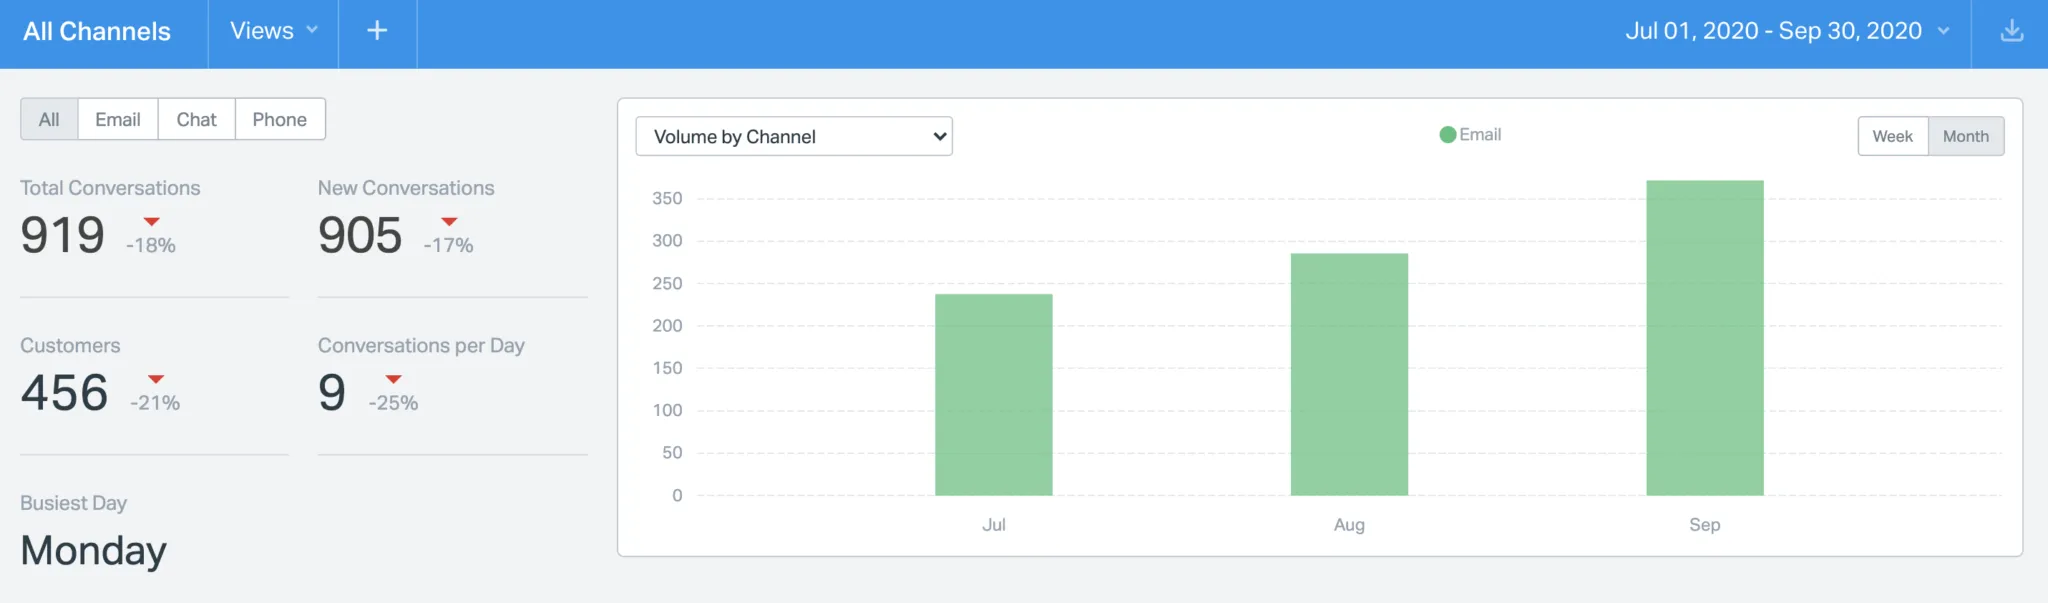
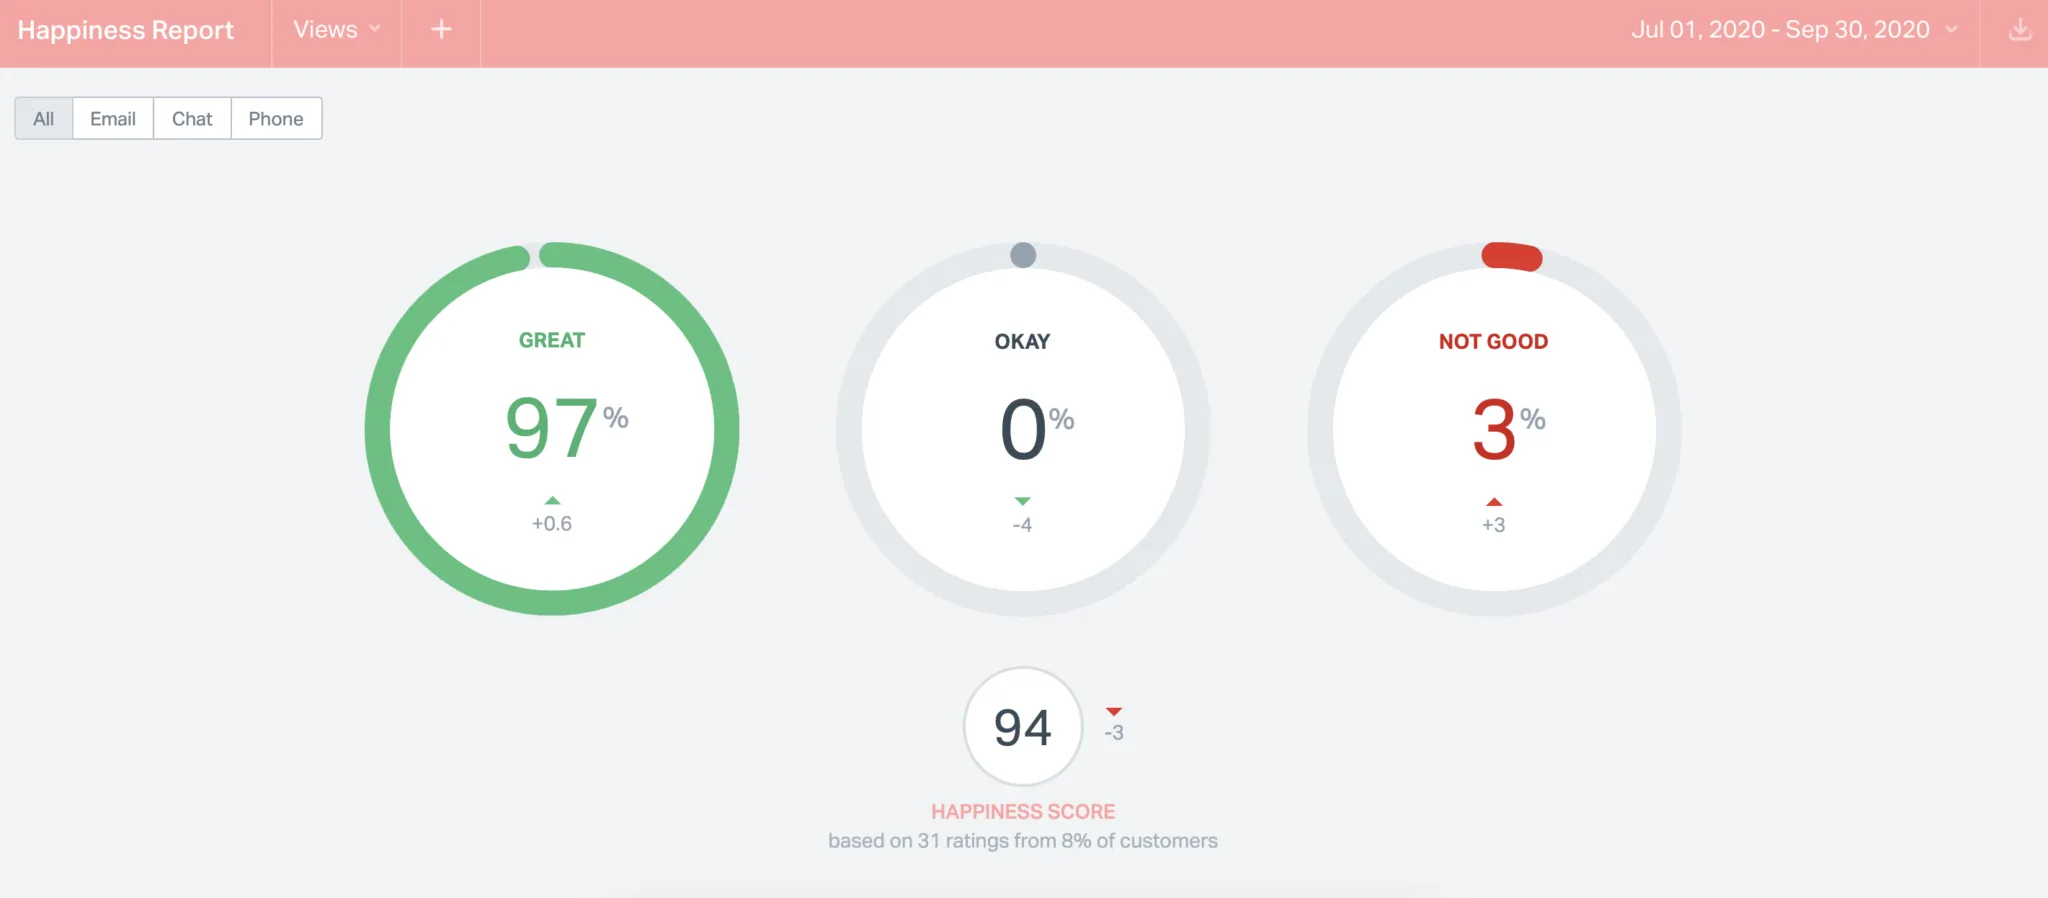
You gave us a 97% happiness score (30 great and 1 not good) which is great!
As you know, our number one metric that we thrive to maintain as low as possible (and improve) is our “First Response Time” aka how long it takes us to respond to and solve the initial ticket with a quality response.
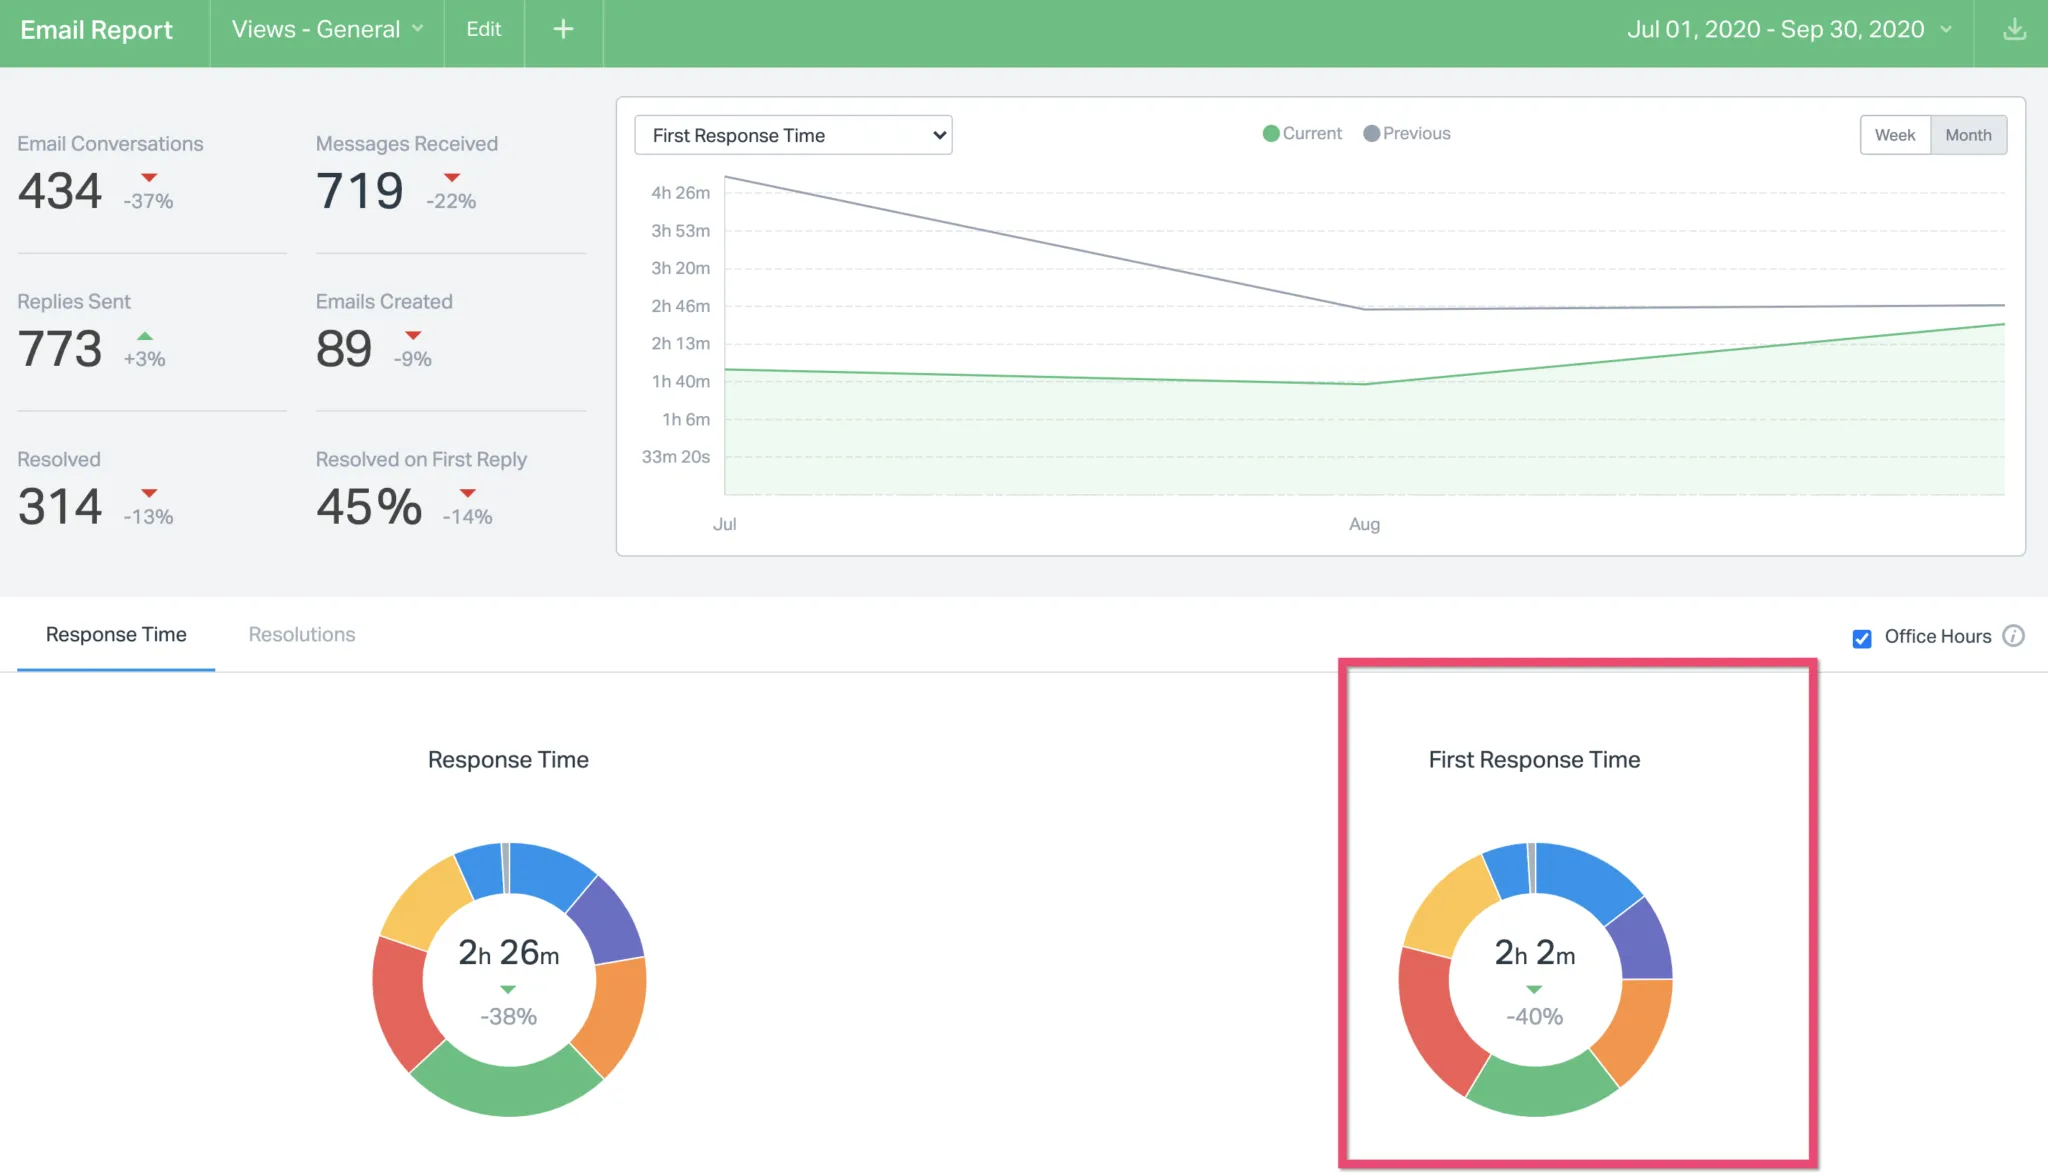
In Q2, our First Response Time was 3h25 and we managed to reduce that number to 2h02 in Q3 which is amazing. Our goal is to get that number to 1h and the summer definitely helped us in getting closer to that goal. We are not sure how it will progress in Q4 with the holidays coming up but we will do our best.
Product
Wildmetrics
In Q3, we achieved a lot and shipped a total of 113 tasks. Our biggest achievement was to have a stable version of Wildmetrics (WMX) meaning that you can now log in, and use the app and it won’t break which wasn’t the case in Q2.
WMX integrates with a lot of tools so we work with a lot of data. In Q2, we had problems pulling the data and our app crashed a lot. In Q3, we started to implement a queuing process by improving our infrastructure to solve this and that allowed us to have a stable version.
We built a lot of new features and the two most important ones are:
Our improved tag analyzer, our tag query builder can handle tag groups and added logic like “add”, “or” and “contains”.
A new dashboard with the following metrics:
Total subs
New subs (based on time selection)
Number of total customers (from Stripe) -> probably “active” customers
New customers from Stripe (based on time selection)
Total revenue (based on time selection)
Revenue per subscriber (based on time selection)
% of subs that are customers (not based on time selection)
Next-up in Q4:
We are planning to develop and work on:
Adding new data points like emails, campaigns, automation, contacts
Revenue per email and automation
Preparing the alpha launch in early January 2021
Automation University
During Q3, we launched a new masterclass on how to produce video Ads for Facebook & Instagram which covers the following:
Wild Audience Methodology: “levels”.
Video ads vs Image ads.
Tools to produce video ads (Advanced / Intermediate / Beginner).
How to use Wave.video to produce your own ads.
Best practices to create high-performance ads.
How to implement ads in your campaigns and what metrics you should focus on.
Next-up in Q4:
We will be publishing a new MasterClass on Google Ads Lead Generation And Retargeting that will cover the following:
Google Ads Overview.
Different ad types & campaigns.
Wild Audience’s PPC strategy for Google Ads.
How to create ads using Google Ads.
The implementation process is explained step-by-step.
Best practices to create & analyze your ads performance.
How to implement ads in your campaigns and what metrics you should focus on.
We currently have 154 students with new joining every month and it’s just €25 per month. We keep the price low on purpose so everyone can learn marketing automation.
Marketing
Traffic Data:
We added 398 new contacts to our list over the last three months. Nothing much has changed lately as we have been working a lot behind the scenes and the summer holidays slowed down everything.
To be honest with you, it’s too low but that number does make sense considering what I have mentioned above. And that’s also on purpose because we are currently focusing on building a partner network and that brings us, customers, directly and not leads.
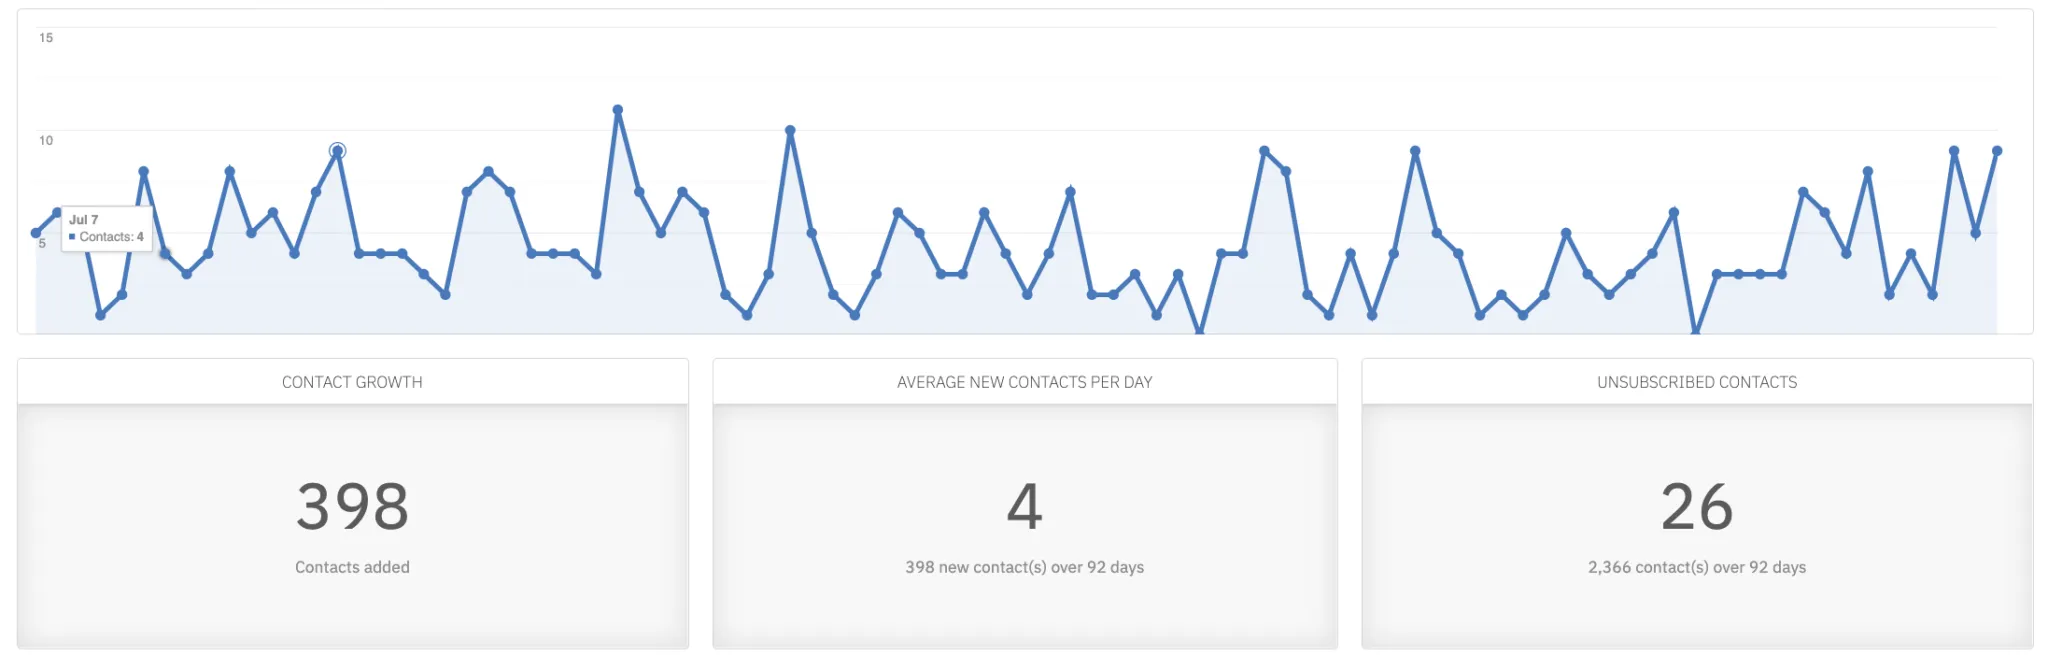
You can also see that our traffic is still mainly organic inbound traffic (52%) and direct (30%) which means that we get very high-quality leads.
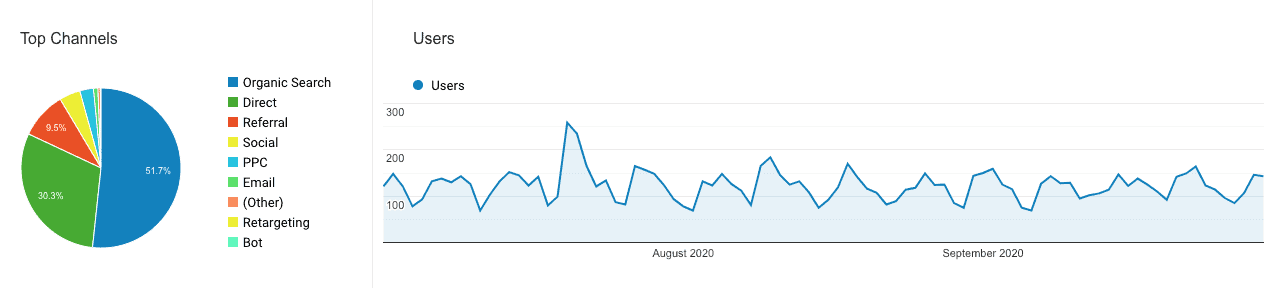
It’s worth mentioning that we would get way more leads by running paid traffic but the quality wouldn’t be as good and as mentioned above, we focus more on customers through partners at the moment.
Relationship Funnel Data:
Traffic: 8,031
Leads: 398 (4,95%)
Trials: 125 (31,40%)
Customers: 42 (33,6%)
A few comments about these numbers:
Traffic is a little bit lower than usual due to the summer holidays and our new partner strategy. On average we have 3,000 visits per month so it should be a minimum of 9,000 now.
Our conversion rate for lead to trial is 31% (benchmark is 30%) and our conversion rate for trial to the customer of 34% (benchmark is 15%) so it’s really good.
Once again, we can see that our Relationship Funnel is working well and the only thing we need to improve is the top of our funnel (cold traffic to lead).
Growth Plan
In Q3, we spent a lot of time creating a new growth strategy and implementing it. We worked on different channels:
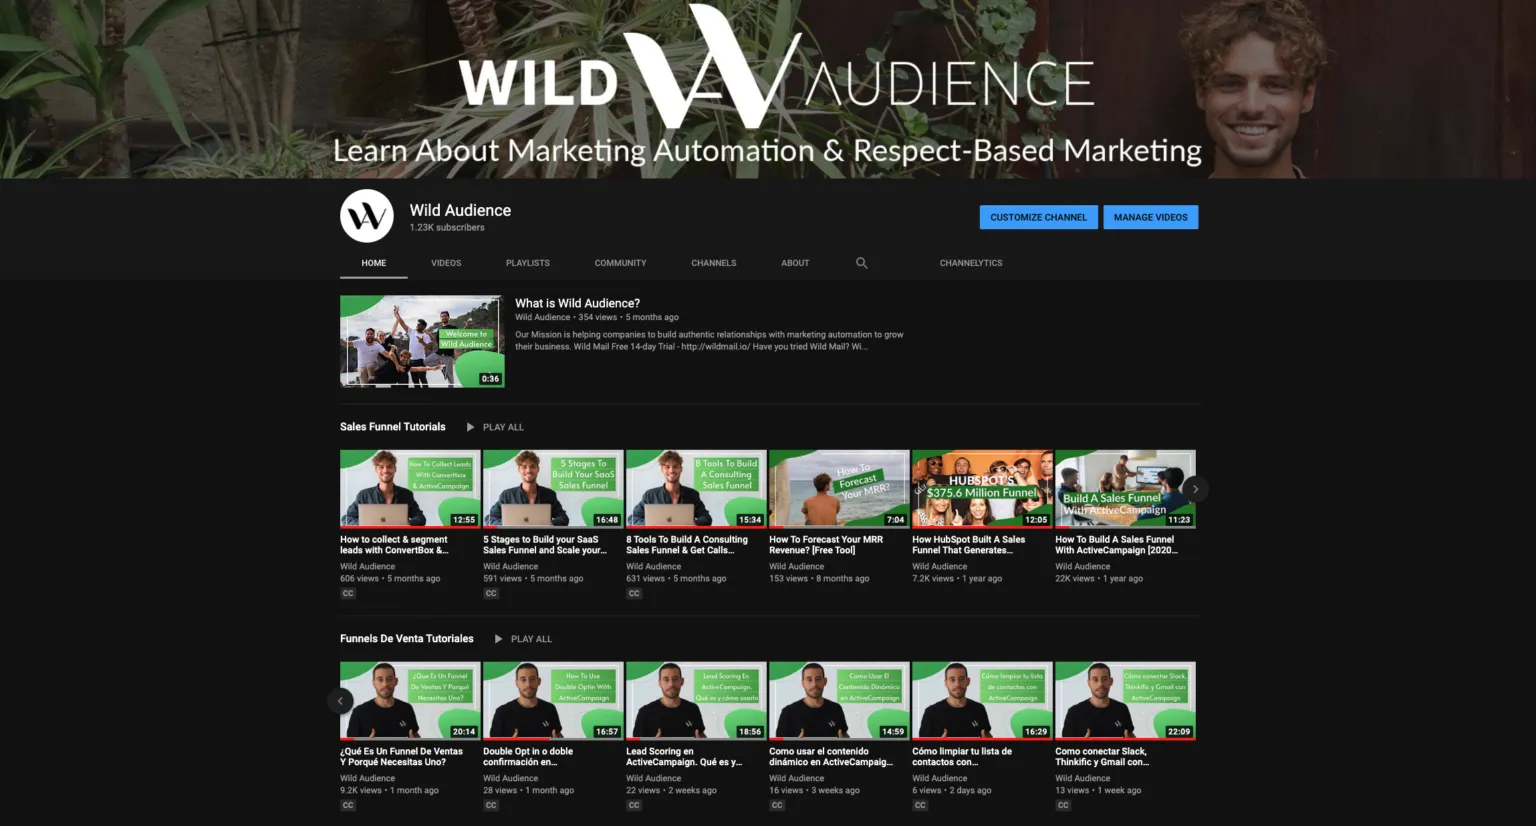
Youtube
Partners
Blog
PPC
We translated 10 articles into Spanish and published 8 new Youtube videos in Spanish based on your feedback and questions. They are all about how to build a funnel, strategy, lead scoring, segmentation and double opt-in.
After looking at the numbers and analysing each channel, we realised that most of our customers were coming from partners so this channel is the most promising one. We then decided to pause all other channels and focus on only one which is developing our partner network.
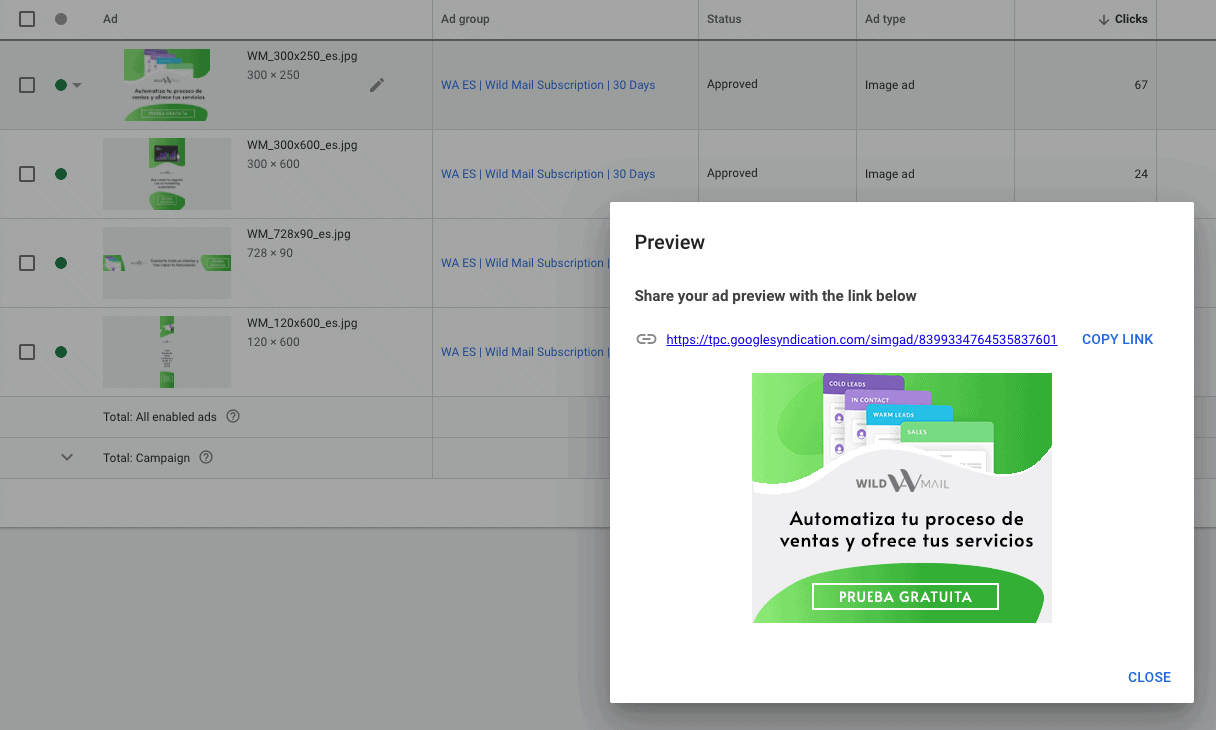
We also want to focus on branding which is very important so we are now using Google Ads Display for branding only as it is cheaper than other channels.
Website
We have been working on another really exciting project during the last few months: a new website design! We have built 15 pages so far in Q3 and we hope to finish creating everything in Q4!
Here is a little sneak peek until we release it.
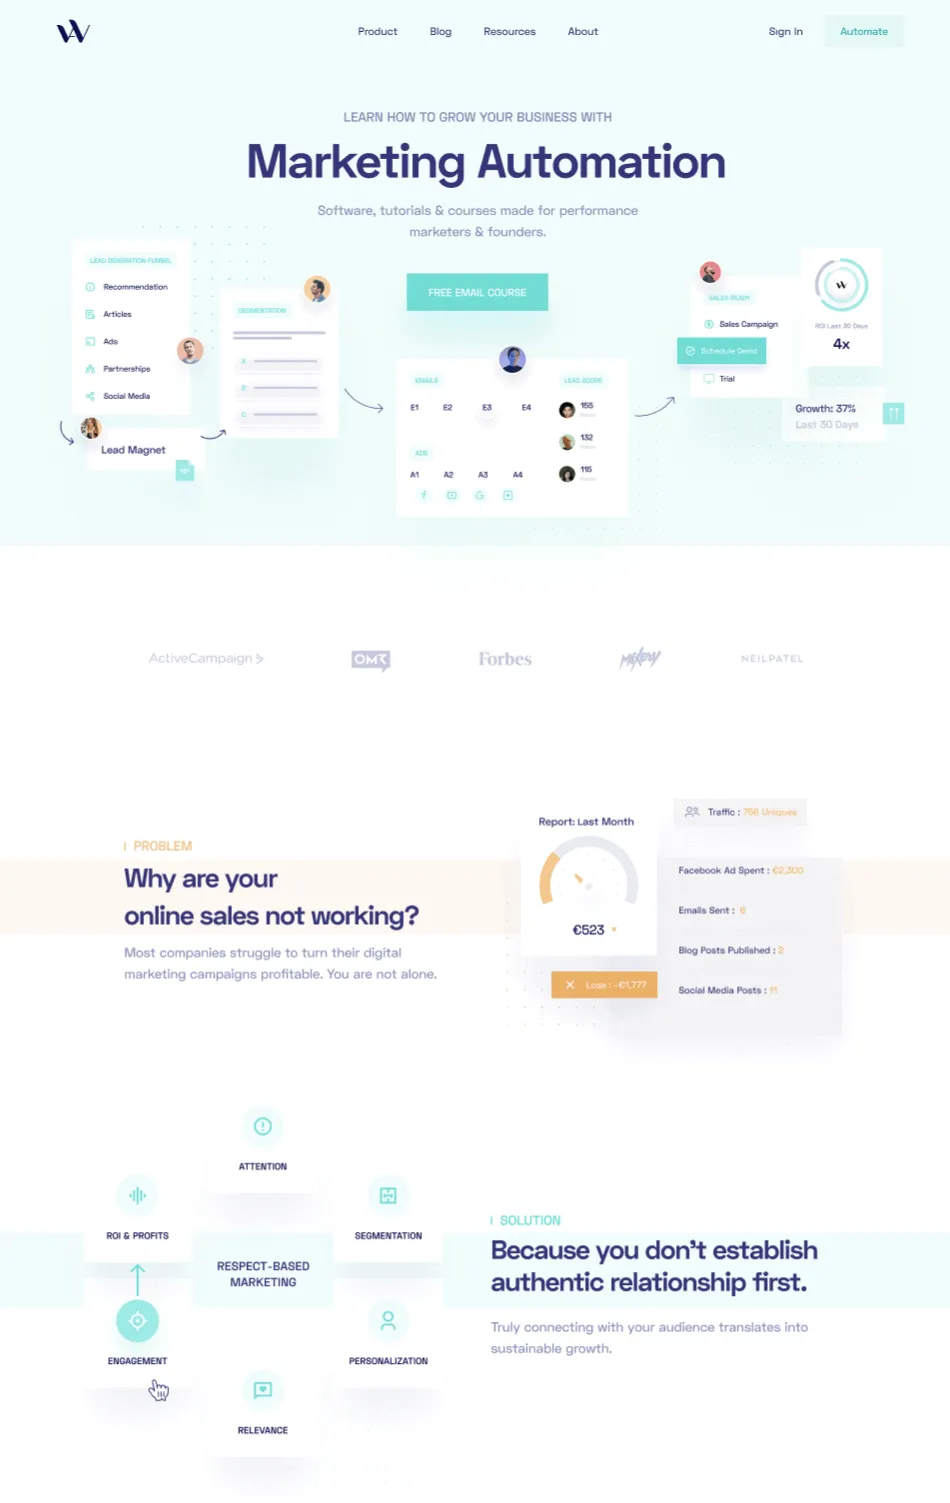
Next-up in Q4:
New website launch with new design & branding (new colour, new font,..) and much more added functionality. The look and feel are very important to us and we have put a lot of thought into it. The idea for us is to be technical, young, fresh and transparent but we will share everything in another article later on.
We will be focusing a lot of our time on our Wild Mail partnership program to improve and develop it.
HR
In Q3, we also decided to hire a new developer so which means:
Creating a new hiring process.
Creating a hiring timeline.
Putting together a job offer and a coding test.
Researching the platform to publish the offer.
It took us two weeks to put everything together which is fairly quick. On the other side, our hiring process is quite long as it involves different people from our team and is divided into 4 different phases. Here is our new hiring process:
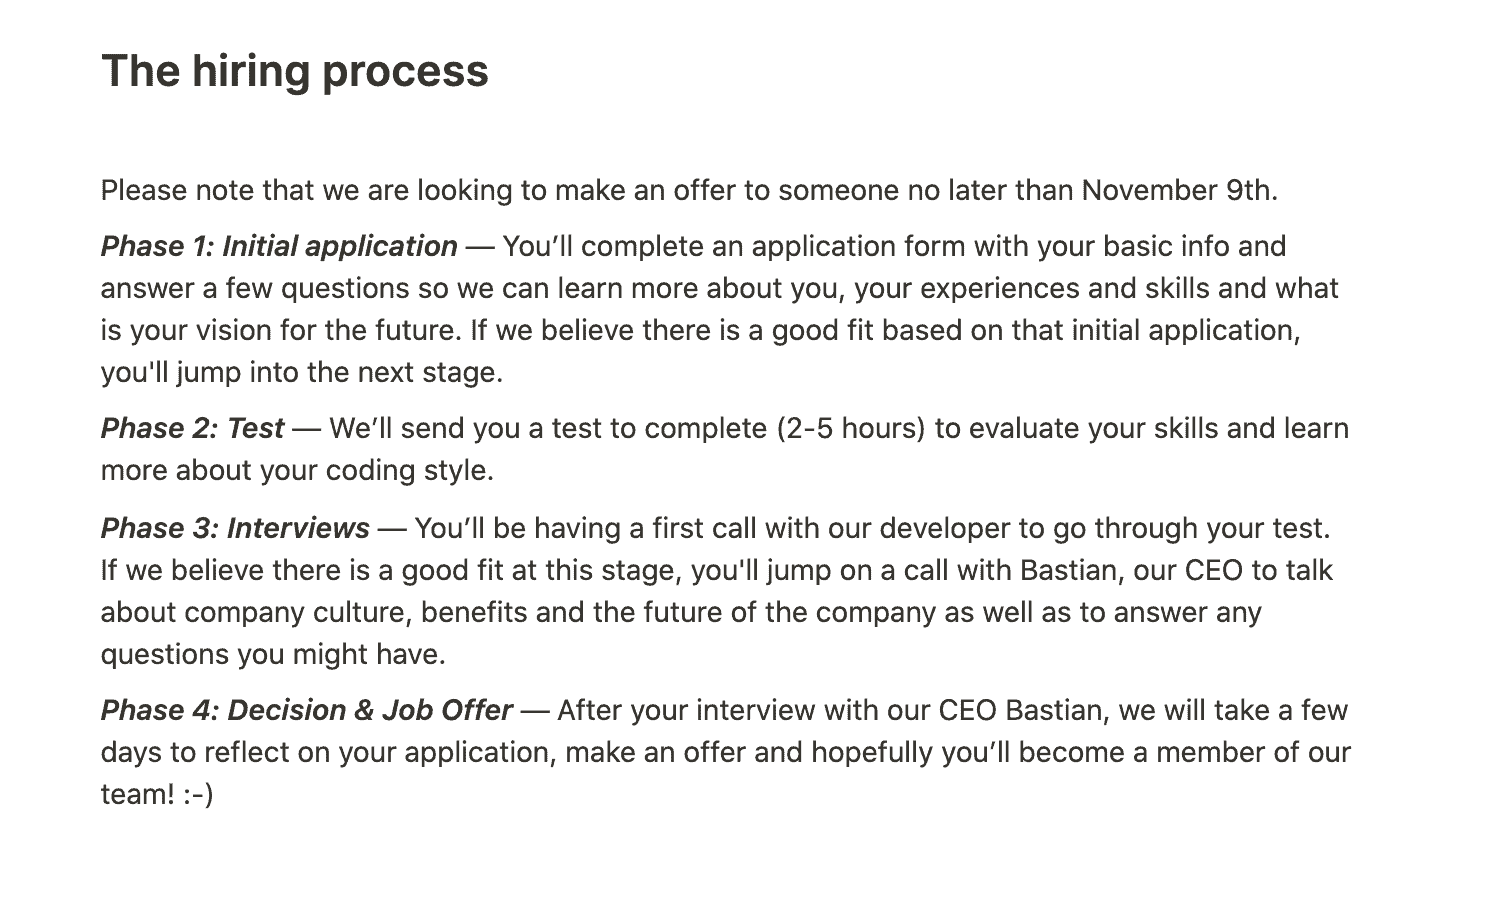
We are pretty happy as we received more applications than expected and our new hiring process worked really well. We’ve received a total of 102 applications and selected 16 candidates to do the test. From there, 6 people were selected to do a technical call with Leandro (our current developer). We are now doing the culture calls hoping to make an offer in the second week of November.
We are really excited to onboard this new team member as well as Leandro who is joining the team as a full-time member of WA. Leandro has been working with us for a few months as a freelance developer. This is very exciting for us and we can’t wait to introduce them to you in our next report.
Next-up in Q4:
We will be making an offer to the selected candidate and onboarding them with Leandro.
Founder Talk
We have learnt a lot in the last three months and while we achieved a lot, the summer gave us the opportunity to slow down. I think it was very important for all of us to take some time off after all the hard work we put in since last year. On average, we worked fewer hours and that allowed us to rest, spend time in nature with our loved ones, explore, surf, and reflect.
Here are some pictures:
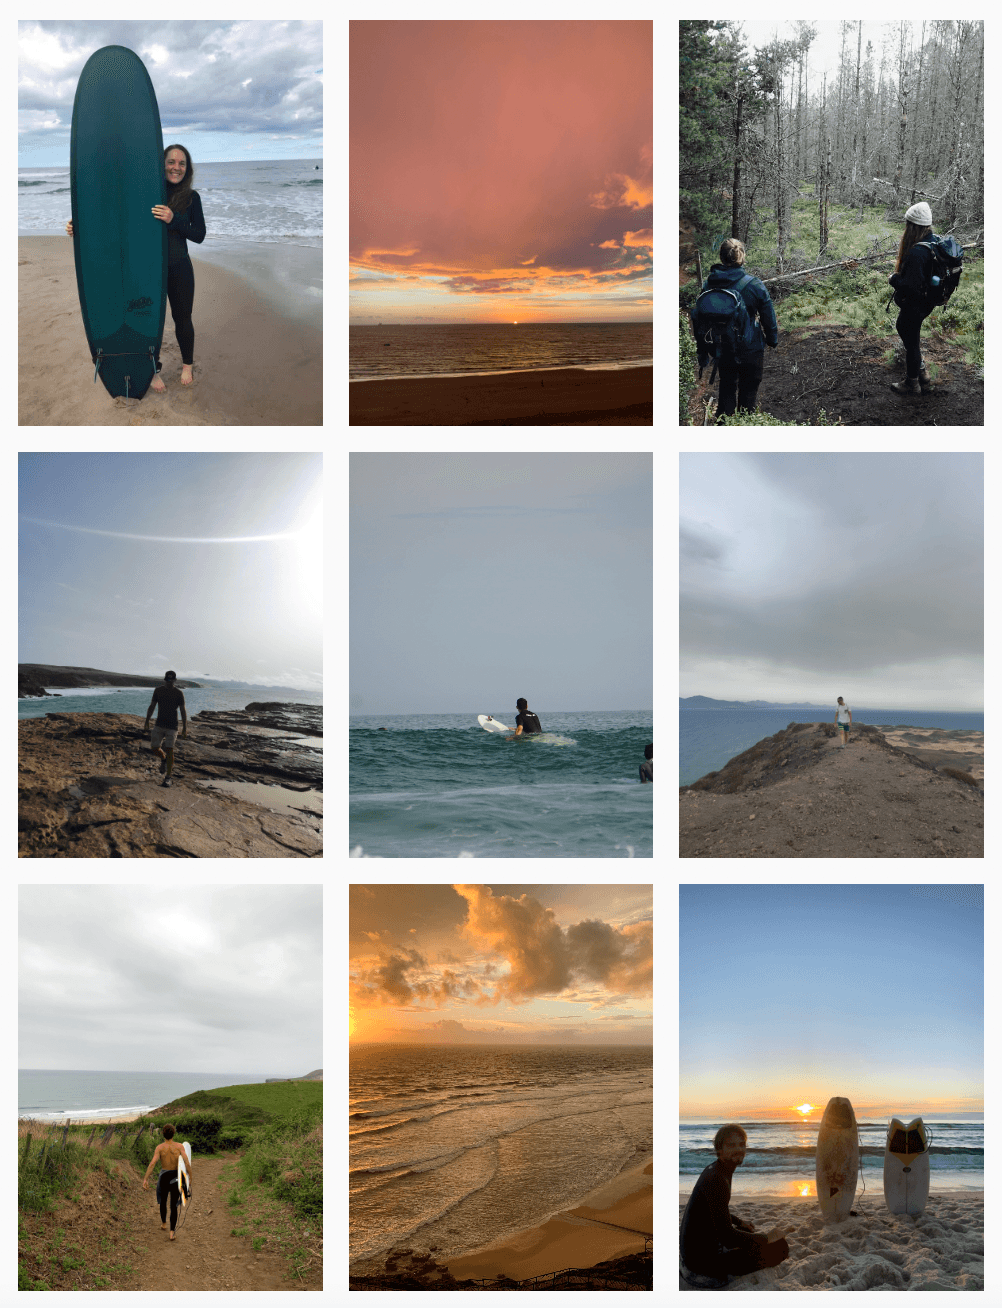
Emilie spent the summer at home by the sea in the northeast of England. I was travelling between Spain and Portugal and Benji was somewhere between Costa Brava and Fuerteventura.
This, was also possible because we have decided to go fully remote as a European team. It’s working well for us and we love the freedom it gives us. We also realised it was time to hire a new team member and with all these new changes, we needed to create a new vision.
Our 2021-2023 vision is the result of hours of thinking and reflection on my side while having a slower summer. I’ve spent a lot of time thinking, reading, talking to people and talking to every team member to create a vision that speaks to all of us.
Now I feel more focused, more connected with the whole team and happier. That vision is us and it’s a huge thing for us and for the future we are creating together (we will share our vision with you next year).
I have also been working a lot on getting Wildmetrics (WMX) ready to onboard our first paying customers so that we can focus 2021 on getting our first paying customers and getting closer to product/market fit.
In November, we will have our Q4 (virtual) team retreat where we will reflect on the year and plan all of 2021 with specifics. Very exciting!
More about this in our next report 🙂